Is Your Research Reliable? Understanding Fleiss’ Kappa
Imagine you are the lead clinical psychologist at a busy diagnostic center. A new patient walks in displaying complex symptoms. You ask three different clinicians to assess this patient independently to determine if they meet the criteria for Major Depressive Disorder.
Doctor A says “Yes.” Doctor B says “No.” Doctor C says “Yes.”
Now, multiply this by fifty patients. If your clinicians are constantly disagreeing, how can you trust your diagnostic process? How do you mathematically prove that your team is on the same page?
This is where Fleiss’ Kappa becomes your most valuable tool.
As researchers and practitioners, we often rely on human judgment—which is inherently subjective. Whether we are coding behavioral observations in a lab or diagnosing patients in a clinic, we need a statistical backbone to prove that our observations aren’t just random luck.
In this guide, we’ll break down what Fleiss’ Kappa is, why “agreement” is different from “correlation,” and how to interpret the results for your psychological research.
When Do We Need Fleiss’ Kappa?
In the world of psychometrics and statistics, choosing the right test is half the battle. You might be familiar with Cohen’s Kappa, which is the gold standard when you have exactly two raters (e.g., two researchers coding a transcript).
But what happens when the study gets bigger?
Fleiss’ Kappa is specifically designed for situations where you have more than two raters evaluating the same items on a nominal scale.

A Quick Refresher on Variables
To use Fleiss’ Kappa effectively, your data must be nominal. In psychology, this usually looks like categorical labels without a natural order:
Yes / No (e.g., Does the patient have depression?)
Type A / Type B / Type C (e.g., Attachment styles)
Present / Absent (e.g., Is a specific behavior occurring in the video?)
If you were measuring blood pressure (metric) or severity of symptoms on a 1-10 scale (ordinal), you would need different statistical tools. Fleiss’ Kappa is purely for categorical agreement.
The Trap: Agreement vs. Association
One of the most common misconceptions I see among psychology students is confusing agreement with association (or correlation). They are not the same thing, and understanding the difference is crucial for your data analysis.
Agreement: Raters give the exact same rating for the same item.
Association: Ratings move in the same direction.
The “Double” Example
Imagine two therapists, Method A and Method B, rating anxiety levels.
Method A gives a score of 2. Method B gives a score of 4.
Method A gives a score of 5. Method B gives a score of 10.
In this scenario, Method B’s score is always exactly double Method A’s score. If you ran a Pearson correlation, you would get a perfect 1.0—a strong association. However, the agreement is terrible because the values are completely different.
In clinical practice, we don’t just want correlation; we want concordance. We want to know that three doctors looking at the same patient arrive at the exact same diagnosis. That is what Fleiss’ Kappa measures.
Reliability vs. Validity: Knowing What You Measure
Before we dive into the calculation, we must make a philosophical distinction that is vital in research methodology.
Fleiss’ Kappa measures Inter-Rater Reliability. It tells you how consistently your raters classify items.
However, it does not tell you if the classification is true (Validity).
If three doctors all mistakenly diagnose a healthy person with depression because of a flawed training manual, Fleiss’ Kappa will be high (perfect agreement). But the validity is low (the diagnosis is wrong).
Reliability: Are we all saying the same thing?
Validity: Are we saying the correct thing?
Fleiss’ Kappa answers the first question. You, as the psychologist, are responsible for ensuring the second.
How Fleiss’ Kappa is Calculated (The Logic)
You don’t need to be a mathematician to understand the logic behind the formula. Essentially, Fleiss’ Kappa compares how much the raters agreed (Observed Agreement) versus how much they would have agreed just by random chance (Expected Agreement).
The formula looks like this:
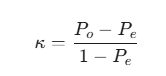
Where:
Po: The observed agreement (what actually happened).
Pe: The expected agreement (chance).
A Case Study: The Depression Diagnosis
Let’s look at an example data set. We have 3 Raters (Clinicians) and 7 Patients. They are rating whether a patient is “Depressed” or “Not Depressed.”
Step 1: Calculate Expected Agreement (Pe). First, we look at the total pool of ratings.
Total ratings = 21 (7 patients × 3 raters).
Let’s say “Depressed” was chosen 13 times (62% of the time).
Let’s say “Not Depressed” was chosen 8 times (38% of the time).
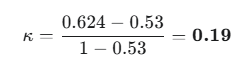
To find the agreement by chance ($P_e$), we square these probabilities and add them up. In this specific example, let’s assume the math gives us a chance agreement of 0.53.
Step 2: Calculate Observed Agreement (Po).Next, we look at how often the raters actually agreed on each specific patient. Did all three say “Yes”? Did two say “Yes” and one say “No”?
Using the formula for observed agreement, we calculate a value. In our example, let’s say it comes out to 0.624.
Step 3: The Final Kappa. Plugging these into our formula:
Interpreting the Results: Is 0.19 Good?
In the world of statistics, context is everything, but we generally follow standard benchmarks (like those from Landis & Koch) to interpret the strength of agreement:
< 0.00: Poor agreement (Less than chance)
0.01 – 0.20: Slight agreement
0.21 – 0.40: Fair agreement
0.41 – 0.60: Moderate agreement
0.61 – 0.80: Substantial agreement
0.81 – 1.00: Almost perfect agreement
In our case study, a result of 0.19 indicates only slight agreement.
What does this mean for the clinician?
If your Kappa is 0.19, your diagnostic tool or your raters are not reliable. It means that if a patient walks into your clinic, their diagnosis depends almost entirely on which doctor they see, rather than their symptoms. As a researcher, this is a signal to pause. You may need to:
Refine your operational definitions.
Retrain your raters.
Clarify the criteria for the variable.
Conclusion: The Power of Consistency
In mental health research, the variables we study—emotions, behaviors, disorders—are rarely black and white. They are nuanced and complex. That is why tools like Fleiss’ Kappa are indispensable. They force us to be rigorous. They challenge us to prove that our observations are consistent and reproducible.
High inter-rater reliability builds trust in your data. It tells the scientific community that your findings aren’t just the subjective opinion of one person, but an observable phenomenon that others can see too.
So, before you publish that next paper, run the numbers. Make sure your team isn’t just associated, but that they are truly in agreement.
Reflection Question:
Think about a time you and a colleague interpreted a client’s behavior differently. How might calculating inter-rater reliability have changed the way you handled that case? Share your thoughts in the comments below.