Finding the “Best Fit”: An Intuitive Guide to Maximum Likelihood Estimation
The Fear of the Unknown (and Statistics)
If there is one thing that unites psychology students and mental health professionals across the globe, it is often a shared, quiet anxiety regarding one specific subject: Statistics.
We entered this field to understand the human mind, to sit with people in their darkest moments, and to unravel the complexities of behavior. We didn’t necessarily sign up to calculate the probability density of a bell curve. Yet, as we dig deeper into research—whether we are analyzing the efficacy of a new therapy or trying to understand the underlying patterns of a disorder—we realize that math is the language we use to translate human chaos into scientific clarity.
Today, I want to demystify a concept that sounds intimidating but is actually quite beautiful: Maximum Likelihood Estimation (MLE).
It underpins everything from the artificial intelligence in ChatGPT to complex medical research. But forget the formulas for a moment. Let’s talk about intuition, “best fits,” and, surprisingly, muffins.
What is Maximum Likelihood Estimation?
In the world of psychology research, we are often like detectives. We collect clues (data), but we don’t always know the full story (the parameters).
For example, let’s say we have a set of anxiety scores from a group of patients. We have the scores (the data), but we want to know the “true” average anxiety level of the population this group came from.
Maximum Likelihood Estimation (MLE) is simply a method for finding the parameters (like the mean or standard deviation) that make our observed data most probable.
Think of it this way: MLE asks, “Given the data I have right in front of me, what model would make this specific outcome the most likely to have occurred?”
The Muffin Theory: A Delicious Analogy
To understand how this works, let’s borrow a brilliant analogy involving muffins.
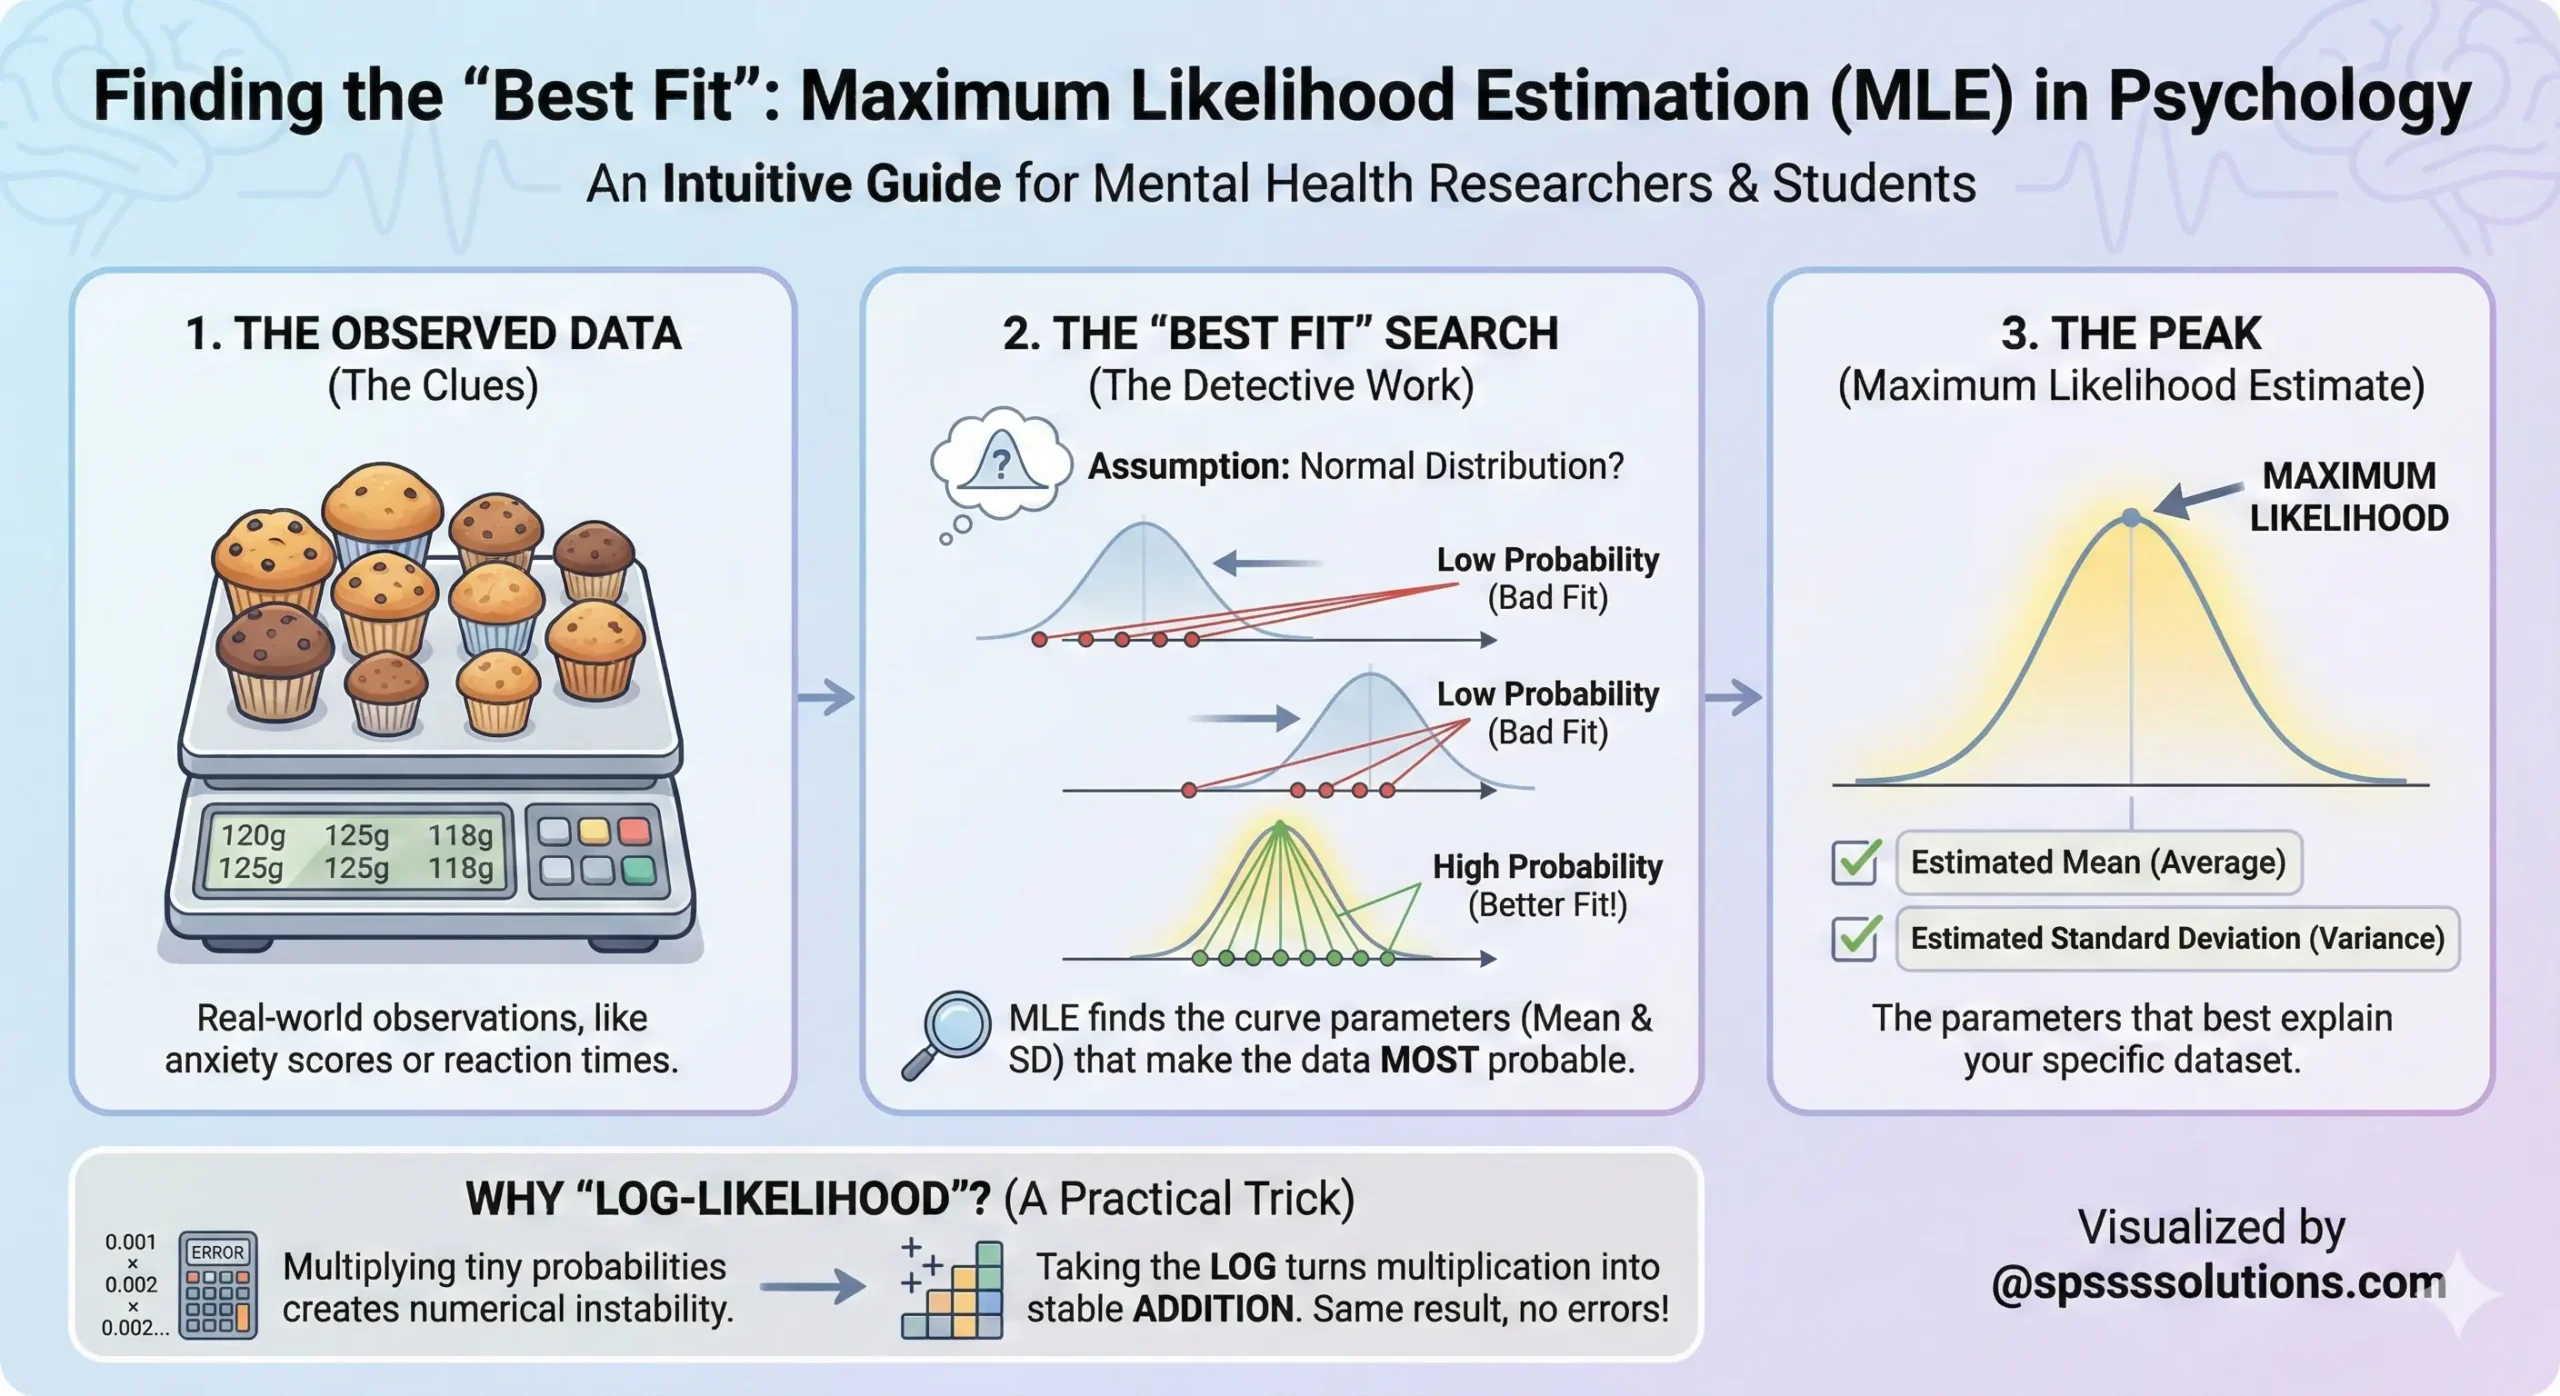
Imagine you bought eight muffins and weighed each one. You have their weights—this is your observed data. Now, you want to estimate the average weight (the mean) and the variance (standard deviation) of all muffins produced by that bakery.
To do this using MLE, we follow a few intuitive steps:
1. The Assumption (The Bell Curve)
First, we assume the data follows a pattern. In psychology, we often use the Normal Distribution (the famous Bell Curve). This curve is defined by where the center is (the Mean) and how wide it is (the Standard Deviation).
2. The “Best Fit” Search
This is where MLE shines. Imagine moving that Bell Curve back and forth along a number line.
If you place the peak of the curve too far to the left, your muffin weights fall on the “tail” of the curve—meaning it’s very unlikely those muffins came from that distribution.
If you place it too far to the right, same problem.
MLE mathematically scans different positions for the mean and different widths for the standard deviation. It draws a virtual line from each data point up to the curve to measure the “density” or likelihood of that point existing under that specific curve.
3. The Peak
The goal is to find the exact spot where, if you combine the probabilities of all your data points, the result is at its maximum. The mean and standard deviation that produce this “peak likelihood” are your estimates.
In clinical terms: We are looking for the explanation that best fits the symptoms we are seeing.
Why Do We “Log” the Likelihood?
If you look at statistical textbooks, you will often see the term Log-Likelihood. This is where many students tune out, but the reason for it is incredibly practical.
When we calculate likelihoods for continuous data (like reaction times or test scores), we are dealing with probabilities, which are often tiny numbers (e.g., 0.001). To get the total likelihood, we have to multiply these tiny numbers together.
If you multiply 0.001 x 0.001, you get an even tinier number. Eventually, the computer can’t handle how small the number is and rounds it to zero.
The Solution: We take the “Log” of the numbers. This turns a multiplication problem into an addition problem. Summing up numbers is much more stable and easier for computers to handle than multiplying microscopic fractions. It gives us the exact same result—the “best fit” parameters—without the numerical errors.
Why This Matters for Mental Health Research
You might be asking, “Why do I need to know this if I’m not a statistician?”
Understanding the logic behind MLE makes you a better consumer of psychological science. MLE is the engine behind the complex models we use to understand the human condition:
Latent Class Analysis: When researchers identify “subtypes” of depression or schizophrenia, they are often using MLE to group patients based on probability.
Item Response Theory (IRT): When we design standardized IQ tests or personality inventories, MLE helps estimate the difficulty of questions and the ability of the test-taker.
AI and Large Language Models: The tools we are beginning to use in therapy apps and diagnostic aids (like LLMs) use principles similar to MLE to predict the next best word or response.
Conclusion
Statistics is not about being perfect; it is about minimizing error and maximizing our understanding of reality. Maximum Likelihood Estimation is just a fancy term for a very human process: looking at the evidence before us and asking, “What is the most plausible explanation for this?”
As we advance in the field of mental health, bridging the gap between clinical empathy and statistical rigor is vital. When we understand the math, we understand the strength—and the limitations—of the research that guides our practice.
Reflections for the Reader
- Have you ever read a research paper and skipped the “Methods” section because the math felt overwhelming?
- How does viewing statistics as a tool for “finding the best fit” change how you view psychological data?
Let me know your thoughts in the comments below!