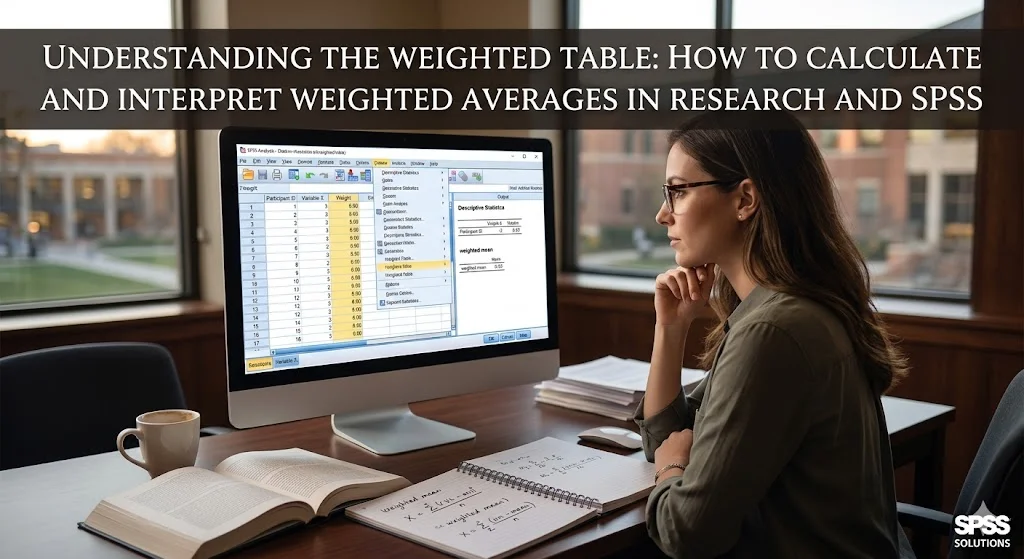
Understanding the Weighted Table: How to Calculate and Interpret Weighted Averages in Research and SPSS
In quantitative research, not all data points hold the exact same level of mathematical importance. When analyzing complex survey results or composite academic scores, researchers often rely on a weighted table to present their findings accurately. A weighted table applies specific numerical weights to different variables, ensuring that the final statistical analysis reflects the true significance of each observation. This technique is absolutely essential for thesis writers and academic researchers who need to correct sampling biases or calculate complex averages.
What is a Weighted Average?
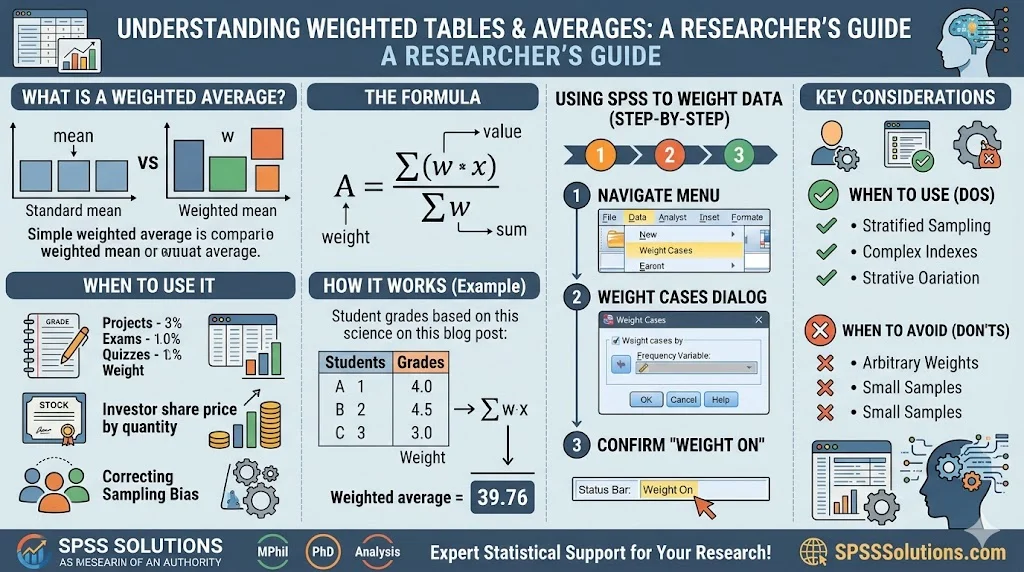
A weighted average represents a specific type of mathematical mean where certain values contribute significantly more to the final calculation than others. The standard arithmetic mean gives equal importance to every single observation within your dataset. Researchers use a weighted mean when the relative significance of individual values differs entirely. You must place specific numerical weights on the values during your statistical calculation process to achieve accurate and reliable results.
This approach is highly common in academic and professional research settings. A university professor might assign a higher weight to a final examination compared to weekly quizzes to reflect the varying difficulty of the required tasks. Financial analysts also use this exact method by multiplying share prices by the number of individual stocks purchased to track overall portfolio performance effectively.
The Mathematical Formula for Weighting Data
Calculating a standard arithmetic mean requires you to sum all individual values and divide that total by the overall count of observations. The weighted average formula introduces a highly distinct mathematical step into this routine process. You must multiply each specific data point by its assigned weight before summing the final mathematical results together.
The formal calculation follows a very specific structural formula. You calculate the final weighted mean using the following standard equation:
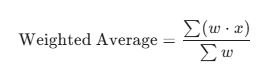
In this specific equation, w represents the numerical weight assigned to each data point, while x represents the actual measured value of that specific observation.
You must multiply the initial value by the designated weight to get a mathematical product. You then sum all of those individual products together into a single number. Finally, you divide that total sum by the sum of all the individual weights utilized in your dataset. If your assigned weights perfectly sum to one, the denominator essentially disappears, and the final weighted mean equals the direct sum of the numerator products.
Creating a Weighted Table in SPSS
Many graduate students rely on SPSS software to handle complex survey data and advanced statistical procedures. Creating a weighted table in SPSS requires you to instruct the program to treat certain participant cases differently based on a specific weighting variable. This step is absolutely crucial when you need to adjust demographic proportions mathematically to match a broader target population accurately.
First, you must ensure you have a specific numeric variable in your active dataset that accurately represents the assigned mathematical weights. Navigate to the top application menu and select Data, followed immediately by Weight Cases. A new dialog box will appear directly on your computer screen. Select the specific option labeled Weight cases by and move your numeric weight variable into the designated Frequency Variable box.
Click OK to apply the new weighting structure to your entire active dataset immediately. You will clearly see a Weight On indicator appear at the bottom right corner of your SPSS window. Once this specific setting is active, any frequency distribution or cross tabulation you run will automatically generate an accurate weighted table. You can then navigate to Analyze, followed by Descriptive Statistics, and select Frequencies to view your newly adjusted statistical results.
When to Use and When to Avoid Weighted Averages
You should always utilize a weighted table when dealing with stratified sampling methods in broad survey research. If your initial survey overrepresented a specific demographic age group, weighting the data ensures the final analysis accurately reflects the true population parameters. It is also the statistically correct method for building complex index scores where certain psychological constructs matter significantly more than others.
You should strictly avoid weighting data if your sampling method relies entirely on convenience and you lack reliable population parameters to guide the weight assignments. Applying arbitrary numerical weights in this scenario can severely distort your statistical findings and lead to completely false research conclusions. Furthermore, applying heavy mathematical weights to extremely small sample sizes often inflates the statistical margin of error artificially.
Expert Support for Your Statistical Analysis
Navigating complex survey designs and interpreting a newly generated weighted table can feel overwhelming during the thesis writing process. Accurate statistical analysis forms the absolute backbone of any successful quantitative research project or dissertation. If you are struggling with data weighting procedures or SPSS navigation, professional statistical guidance can help you move forward with immense confidence.
Our dedicated team at SPSS Solutions provides comprehensive statistical consulting tailored specifically for MPhil and PhD researchers. We can assist you directly in calculating accurate data weights, running the correct statistical tests, and interpreting your complex SPSS output for your final manuscript. Reach out to our team today to ensure your methodology and data analysis accurately meet the highest academic standards.
References
- Field, A. (2018). Discovering statistics using IBM SPSS statistics (5th ed.). SAGE Publications.
- Heeringa, S. G., West, B. T., & Berglund, P. A. (2017). Applied survey data analysis (2nd ed.). Chapman and Hall/CRC.
- Howell, D. C. (2012). Statistical methods for psychology (8th ed.). Cengage Learning.
- IBM Corporation. (2021). IBM SPSS Statistics for Windows, Version 28.0. IBM Corp.
- Pallant, J. (2020). SPSS survival manual: A step by step guide to data analysis using IBM SPSS (7th ed.). Routledge.