Understanding Cronbach’s Alpha: Reliability in the Alphanumeric Assessment Test
Cronbach’s alpha is a fundamental statistical measure used to evaluate the internal consistency of a survey or measurement instrument. Internal consistency refers to how well a set of items measures a single, underlying characteristic. Researchers rely on this metric to ensure their instruments produce reliable and stable results.
For instance, if you are designing an alphanumeric assessment test to evaluate cognitive processing speed, you need assurance that all questions accurately target that specific construct. Utilizing this statistic early in your methodology prevents flawed data collection. It quantifies item agreement on a standardized scale from zero to one.
High values indicate that participants who score well on one question are highly likely to score well on related questions. This uniformity suggests the measurements are dependable. Conversely, low values reveal that the items do not consistently measure the same property, signaling a flawed or fragmented questionnaire design.
What is Cronbach’s Alpha Used For?
Analysts and researchers frequently calculate Cronbach’s alpha during the pilot phase of instrument development. Before distributing a survey to a massive sample, they must confirm the quality of the tool. This step acts as a diagnostic check for reliability.
Most psychological and academic assessments ask multiple questions about the same concept. Grouping related items allows researchers to capture a nuanced picture of a complex phenomenon. However, combining multiple items into a single scale requires statistical proof that the items actually belong together.
Imagine a university developing a new alphanumeric assessment test for admission screening. If all the test items genuinely assess the same cognitive skill, the participant scores across the items should generally align. High performers will score high across the board, yielding a strong internal consistency coefficient.
If the test accidentally includes questions measuring completely different traits, the scores will scatter. A candidate might score perfectly on some items and poorly on others. This disagreement drives the coefficient down, warning the researcher that the scale needs revision before final deployment.
Assumptions for the Analysis
Like all statistical procedures, this calculation relies on specific assumptions about your data. The data usually originates from Likert scale responses, binary choices, or continuous test scores. The primary mathematical assumption is that all items measure the same latent trait using an identical scale.
Statisticians refer to this as the tau-equivalent model. It assumes that each item contributes equally to the total scale score. While minor violations of this assumption are common in social sciences, severe deviations can artificially inflate or deflate your reliability estimates, leading to incorrect methodological conclusions.
How to Interpret the Output Values
Interpreting the results requires more nuance than simply aiming for the highest possible number. The coefficient ranges from zero to one. A value of zero indicates no correlation among the items, meaning they are completely independent of one another.
A value of one indicates perfect correlation, where knowing one response gives complete information about all other responses. In actual research, your value will land somewhere between these extremes. A commonly accepted benchmark in academic research is 0.70. Values at or above this threshold indicate acceptable reliability.
It is entirely possible for a reliability coefficient to be too high. Values exceeding 0.95 often indicate unacceptable item redundancy. If respondents provide identical answers to multiple questions, the questions are likely too similar. In these cases, removing redundant items can streamline the survey without losing valuable data.
The Difference Between Reliability and Validity
A high internal consistency score confirms reliability but does not guarantee validity. Reliability means the instrument measures something consistently. Validity means the instrument measures the correct concept. Understanding this distinction is critical for defending your methodology in a thesis or dissertation.
For example, the items on your questionnaire might produce highly consistent responses. However, they might accidentally measure general test-taking anxiety rather than the intended cognitive skill. To prove validity, researchers must pair reliability checks with techniques like exploratory factor analysis or principal components analysis.
The Mathematical Formula
Most researchers rely on statistical software to handle the complex mathematics behind this metric. However, understanding the basic formula clarifies how the interactions between variables influence the final score. The standard equation is written as:
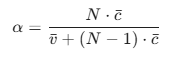
In this formula, N represents the total number of items. The c represents the average covariance between the items, and v represents the average variance. A high final value requires the covariance to be high relative to the variance. Adding more items generally increases the final coefficient.
How to Run the Analysis in SPSS
Conducting this analysis in SPSS is straightforward and requires only a few clicks. Before starting, ensure your data is properly coded and that any reverse-phrased items have been recoded.
- Click on Analyze in the top menu bar.
- Navigate to Scale and select Reliability Analysis.
- Select the items you want to test and move them into the Items box.
- Ensure the Model dropdown is set to Alpha.
- Click the Statistics button.
- Under the Descriptives for section, check the box for Scale if item deleted.
- Click Continue and then OK.
Interpreting the SPSS Output
The output viewer will display several tables. The Reliability Statistics table provides the overall Cronbach’s alpha for your scale. This is the primary number you will report in your methodology chapter.
The Item-Total Statistics table is incredibly valuable for troubleshooting. Look specifically at the column labeled Cronbach’s Alpha if Item Deleted. This column reveals what the overall reliability would be if you removed a specific question from your scale.
If removing a question substantially increases your overall score, that specific question is likely confusing, poorly worded, or measuring a different construct. Researchers use this diagnostic column to systematically eliminate poor questions and refine their final assessment tools.
Real Research Example
Consider a research team validating a new alphanumeric assessment test designed for corporate hiring. The pilot study includes four items measuring rapid pattern recognition. They test 60 participants using a standardized scoring matrix. The initial SPSS output shows an overall alpha of 0.65, which falls below the acceptable academic threshold.
The researchers examine the Item-Total Statistics table. They notice that Item 4 asks participants to solve a basic algebra equation, whereas the first three items strictly involve identifying mismatched letters and numbers.
The column indicates that removing Item 4 will raise the overall score to 0.88. Because the algebra question measures mathematical knowledge rather than rapid pattern recognition, it disrupts the internal consistency. The researchers remove Item 4, achieving a highly reliable three-item scale ready for corporate deployment.
If you are struggling to interpret your own reliability statistics or need help validating your research instruments, professional guidance can save you weeks of frustration. Reaching out to a specialized data consultant ensures your thesis methodology is rigorous, accurate, and ready for defense.
References
- Cronbach, L. J. (1951). Coefficient alpha and the internal structure of tests. Psychometrika, 16(3), 297–334. https://doi.org/10.1007/BF02310555
- DeVellis, R. F. (2016). Scale development: Theory and applications (4th ed.). Sage Publications.
- Field, A. (2018). Discovering statistics using IBM SPSS statistics (5th ed.). Sage Publications.
- Hair, J. F., Black, W. C., Babin, B. J., & Anderson, R. E. (2019). Multivariate data analysis (8th ed.). Cengage Learning.
- Pallant, J. (2020). SPSS survival manual: A step by step guide to data analysis using IBM SPSS (7th ed.). Routledge.
- Taber, K. S. (2018). The use of Cronbach’s alpha when developing and reporting research instruments in science education. Research in Science Education, 48(6), 1273–1296. https://doi.org/10.1007/s11165-016-9602-2