Understanding the Birthday Paradox: How to Analyze and Create a Graph of Birthdays
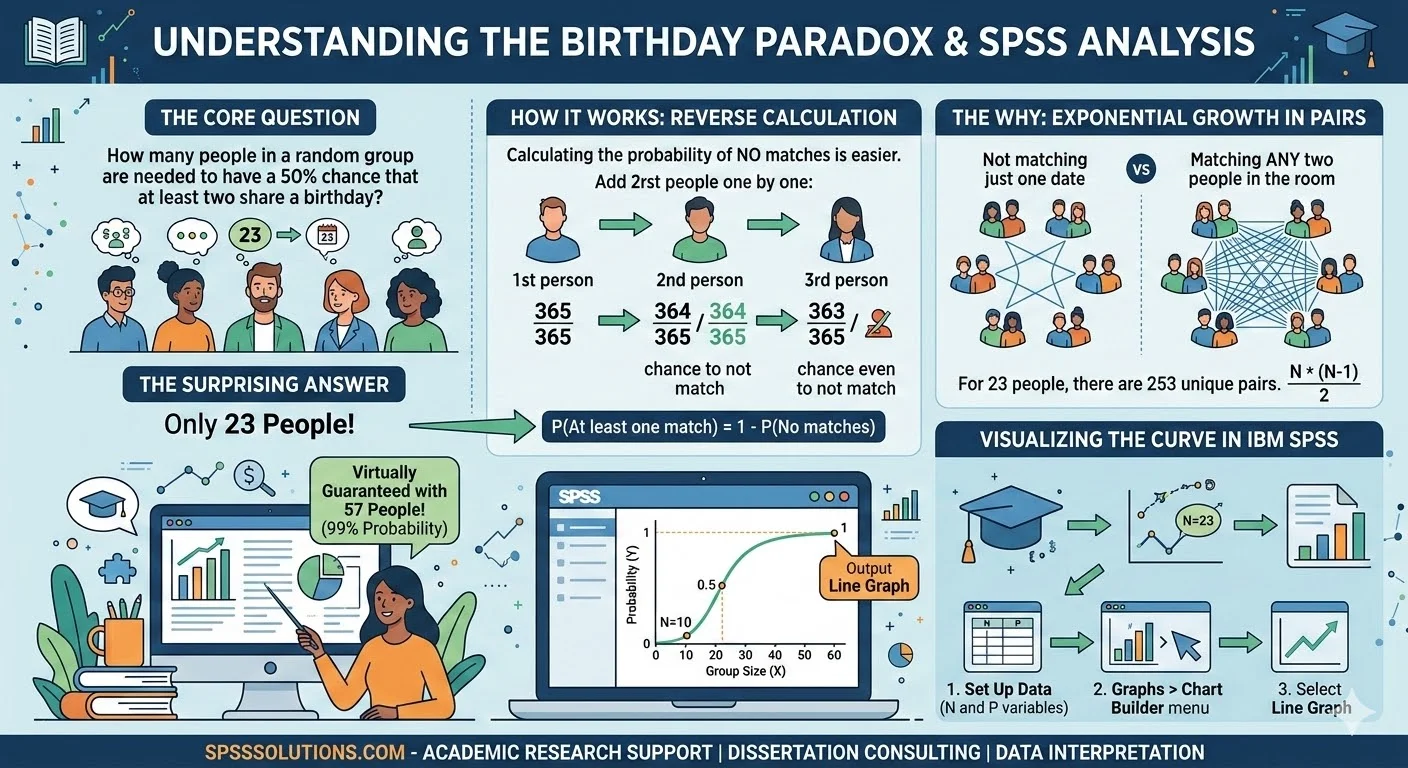
The birthday paradox is a classic statistical problem that consistently challenges human intuition. It asks a simple question about probability. How many people must be in a room to have a fifty percent chance that two individuals share the exact same birthday? Most people guess a high number, but the actual answer is exactly 23 people.
Researchers often plot a graph of birthdays to demonstrate how rapidly this mathematical probability scales. This visual representation makes the counterintuitive numbers much easier to comprehend for students. We will explore the core calculations and demonstrate how to model this fascinating phenomenon using professional statistical software.
The Mathematics Behind Shared Birthdays
Calculating this probability requires looking at the problem in reverse. Instead of finding the direct odds of a match, statisticians calculate the probability that absolutely no one shares a birthday. We then subtract that final figure from one. This approach simplifies the mathematical process significantly.
The first person has a 365 out of 365 chance of holding a unique birthday. The second person has a 364 out of 365 chance of not matching the first. We systematically multiply these fractions as we add more individuals to the group. The probability of unique birthdays drops rapidly as the group size increases.
Why the Group Size is Surprisingly Small
The human brain struggles with this concept because we usually think of our own specific birthday. We naturally consider the odds of one random person matching our exact date. The birthday problem actually compares every possible pair of individuals within the room to find any match.
In a group of exactly 23 people, there are not just 23 isolated chances for a match. There are actually 253 distinct pairs to compare. This exponential growth in possible combinations explains why the probability reaches 99 percent with a group size of just 57 people.
Visualizing the Data: Creating a Graph of Birthdays in SPSS
Creating a graph of birthdays in SPSS helps visualize this exponential curve effectively. You can set up a simple dataset where one variable represents the total number of people and another represents the calculated probability. Using the SPSS Chart Builder allows you to plot these specific points quickly.
To build the visualization, navigate to Graphs and then select Chart Builder in the top menu. Select a basic Line graph and drag it directly to the main canvas. Place the group size variable on the X axis and the probability variable on the Y axis.
Simulating the Birthday Problem for Research Applications
You can also simulate this paradox in SPSS using the dedicated syntax window. By generating random numbers between 1 and 365 across multiple cases, researchers can test the theoretical probability against simulated data. This remains a highly common and practical exercise in quantitative research methods courses.
Understanding foundational probability concepts is strictly crucial for graduate students working on quantitative research designs. Misinterpreting statistical odds can easily lead to flawed methodology in a complex thesis or dissertation. Ensuring rigorous data analysis remains the ultimate cornerstone of academic and professional research success.
Statistical modeling and complex probability distributions can be challenging to navigate alone. If you are struggling with advanced data analysis or require specific assistance with SPSS for your academic research, professional support is readily available. Our team provides expert guidance to help you accurately interpret and present your findings.
References
- Agresti, A. (2018). Statistical methods for the social sciences (5th ed.). Pearson.
- American Psychological Association. (2020). Publication manual of the American Psychological Association (7th ed.). https://doi.org/10.1037/0000165-000
- Feller, W. (1968). An introduction to probability theory and its applications (3rd ed., Vol. 1). John Wiley & Sons.
- Field, A. (2018). Discovering statistics using IBM SPSS statistics (5th ed.). SAGE Publications.
- Wackerly, D., Mendenhall, W., & Scheaffer, R. L. (2008). Mathematical statistics with applications (7th ed.). Thomson Brooks/Cole.