
Mystery of Cronbach’s Alpha: A Guide to Internal Consistency in Research
You are a researcher—or perhaps a psychology student working on your thesis. You have a burning hypothesis. You believe that extroverted people earn higher salaries than introverted people.
To prove this, you need data. You sit down, craft a brilliant questionnaire, and send it out to hundreds of participants. The responses roll in. You feel a rush of excitement. But then, a nagging question creeps into the back of your mind:
“Is my questionnaire actually measuring what I think it’s measuring? Or is it just a random collection of questions?”
This is the nightmare of every social scientist. In psychology, we can’t measure traits like anxiety, extraversion, or intelligence with a ruler or a thermometer. We have to rely on scales. And to trust those scales, we need a mathematical “trust score.”
Enter Cronbach’s Alpha—the guardian of internal consistency.
In this post, we’re going to demystify this statistical concept. We will move beyond the complex formulas and look at the heart of what makes a psychological measure valid, reliable, and scientifically sound.
What Exactly is Cronbach’s Alpha?
At its core, Cronbach’s Alpha is a statistic used to measure the internal consistency or reliability of a psychometric scale.
Think of a rowing team. If everyone in the boat is rowing in the same rhythm and direction, the boat moves smoothly. That is high internal consistency. If half the team is rowing left and the other half is rowing right, the boat spins in circles. That is low internal consistency.
In research terms, if you create a survey to measure Extraversion, you want every question (item) in that survey to “row” in the same direction. Cronbach’s Alpha tells you if they are doing just that.
The Challenge of the “Latent Variable”
To understand Alpha, we first have to understand the problem we are solving. In psychology, we deal with latent variables.
A latent variable is a concept or construct that you cannot observe directly. You cannot open up a brain and see “Extraversion” sitting there. Instead, we have to measure it indirectly using proxies.
The Item: A single question or statement (e.g., “I enjoy going to loud parties”).
The Scale: A collection of items that, when combined, estimate the latent variable.
When we average the scores of these items, we get an estimate of how extroverted a person is. But this only works if the items are actually related to one another.
How Internal Consistency Works
Let’s stick with our example of Extraversion. Suppose you have a scale with these three items:
I love meeting new people.
I feel comfortable in crowds.
I prefer staying home and reading a book. (Reverse scored)
If a participant answers “Strongly Agree” to Item 1, they should also agree with Item 2, and disagree with Item 3.
This is the logic of Cronbach’s Alpha: It looks at the correlation between the items.
High Alpha: Indicates that people who score high on one item tend to score high on the others. The items are “hanging together.”
Low Alpha: Indicates the items are unrelated. Perhaps one question asks about parties, and another asks about favorite ice cream flavors. They don’t measure the same underlying construct.
The “Math” Without the Headache: How is it Calculated?
While modern software like SPSS, R, or JASP will calculate this for you with a click of a button, it is important to understand what is happening under the hood.
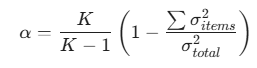
The formula for Cronbach’s Alpha relies on two main things:
The number of items (K): Generally, having more items (up to a point) increases reliability.
The variance: specifically, the relationship between the variance of individual items versus the variance of the total score.
The Formula Concept
Interpreting Your Results: The “Goldilocks” Zone
So, you’ve run the analysis. You have a number. What does it mean? Cronbach’s Alpha ranges from 0 to 1.
Here is a general rule of thumb used in psychological research (though context always matters!):
0.90 and above: Excellent consistency. However, be careful—if it’s too high (like 0.99), your questions might be redundant (i.e., you are asking the exact same thing three times).
0.80 to 0.90: Good. This is a strong scale.
0.70 to 0.80: Acceptable. This is often the cutoff for research purposes.
0.60 to 0.70: Questionable. You might need to refine your questions.
Below 0.60: Poor. The items are not measuring the same construct effectively.
A Critical Warning: The Assumption of Unidimensionality
There is one major trap that new researchers fall into. Cronbach’s Alpha assumes your scale is unidimensional—meaning it measures only one latent variable.
Imagine you have a survey that mixes questions about Depression and Intelligence.
“I feel sad often.” (Depression)
“I am good at math.” (Intelligence)
You could calculate an Alpha score for this mix, but it would be meaningless. You cannot trust Alpha blindly; you must ensure via Exploratory Factor Analysis (EFA) that your items actually belong to the same family before you test how well they get along.
Conclusion
It is easy to view statistics as cold, hard numbers. But in the field of mental health and psychology, statistics like Cronbach’s Alpha are actually tools of empathy.
Why? Because they ensure we are listening accurately.
When we create a scale to measure depression, anxiety, or personality, we are trying to understand a human experience. If our scale is unreliable (low Alpha), we are misinterpreting that experience. We are getting a “static-filled” signal. By ensuring high internal consistency, we ensure that when a client or participant tells us who they are through a survey, we are receiving the message clearly.
So, the next time you see that Greek letter $\alpha$, don’t just think of it as a hoop to jump through for your class or publication. Think of it as the quality control check that ensures your research respects the complexity of the human mind.
Reflection for the Researcher
Ask yourself: Look at a survey you recently created or took. Can you identify the “latent variable” it was trying to measure? Did the questions feel repetitive (high consistency) or did they feel disjointed (low consistency)?