Overfitting in SPSS: When Your Regression Is Too Much
Building a statistical model for your thesis often feels like a balancing act. Researchers frequently want to include every available variable to explain their dependent variable perfectly. However, at some point, adding predictors to your regression is too much, creating a statistical trap known as overfitting. This compromises the integrity of your research findings.
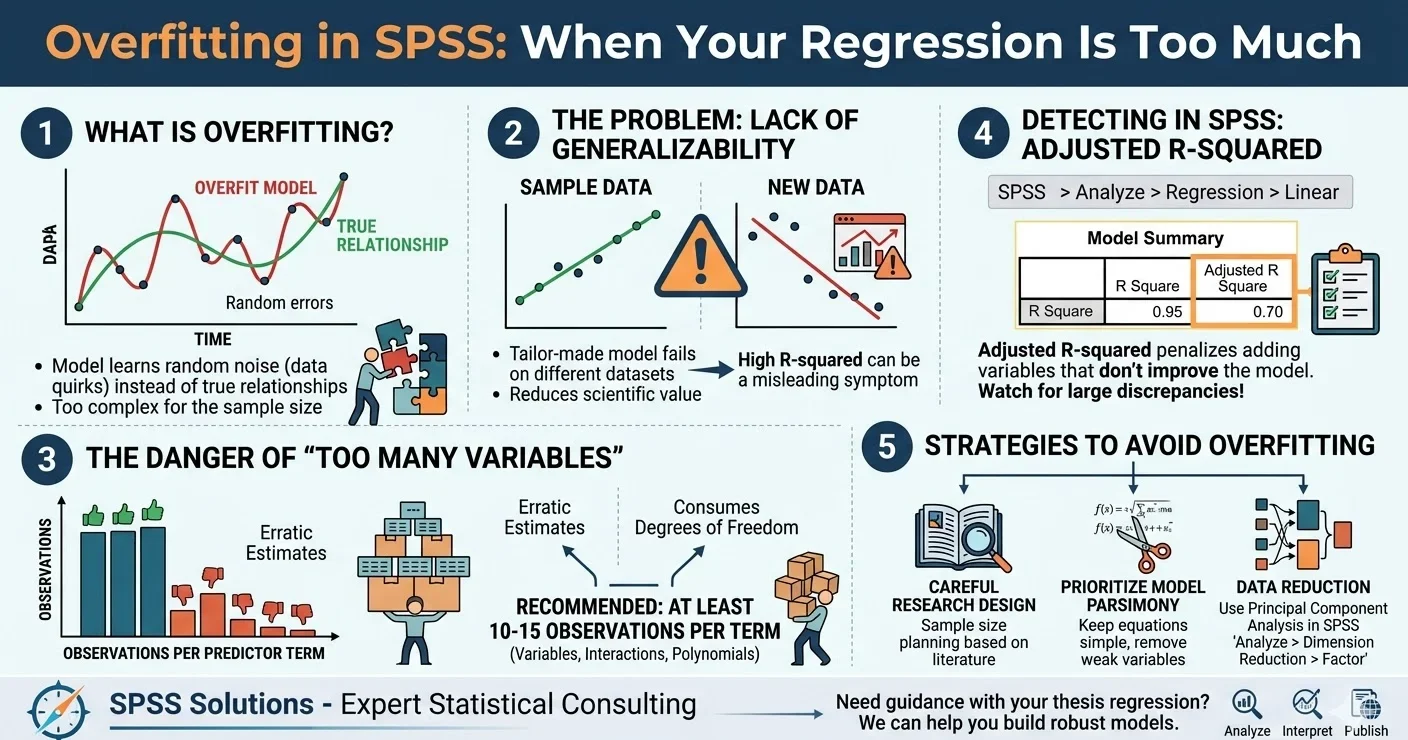
Overfitting occurs when a statistical model learns the random noise in a specific dataset rather than the true underlying relationship between variables. A complex model might look impressive on paper. It might even yield a high R-squared value. Unfortunately, this tailor-made model will fail to predict outcomes accurately when applied to a different sample.
When you overfit a model, you sacrifice generalizability. The primary goal of inferential statistics is to draw conclusions about a broader population from a random sample. If your model only describes the unique quirks of your specific data collection, it has little scientific value. Researchers must prioritize building models that apply outside their original dataset.
Why Adding Variables Causes Statistical Problems
Every time you add a new independent variable to your regression model, you consume degrees of freedom. Your sample size dictates how many parameters you can reliably estimate. If you attempt to estimate too many parameters with too few observations, your regression coefficients become erratic and untrustworthy.
Statisticians generally recommend having at least 10 to 15 observations for every predictor term in your linear model. This count includes all independent variables, interaction terms, and polynomial terms. If your study incorporates five variables and their interactions, you need a substantial sample size to support that complexity safely.
Consider a master’s student analyzing consumer behavior with a sample size of 40 participants. If they include eight predictors in their multiple regression, the model lacks the data required to establish reliable estimates. The results will likely highlight random sample fluctuations rather than genuine market trends.
How to Detect Overfitting in SPSS
Identifying an overfit model requires looking beyond the standard R-squared value. Standard R-squared always increases or remains the same when you add predictors, even if those predictors are practically useless. This false inflation often misleads novice researchers into thinking their complex model is performing exceptionally well.
To detect overfitting in SPSS, you should focus on the Adjusted R-squared value. Adjusted R-squared penalizes your model for adding variables that do not significantly improve the predictive power. A large discrepancy between the standard R-squared and the Adjusted R-squared is a strong warning sign of an overfit model.
You can easily check this metric during your standard analysis process. In the SPSS top menu, navigate to Analyze, select Regression, and then click Linear. After moving your variables into the appropriate boxes, run the test. The output viewer will generate a Model Summary table containing both R-squared metrics for comparison.
Strategies to Avoid Overfit Models in Research
The most effective way to prevent overfitting is careful research design and adequate sample size planning. Before collecting data, review similar peer-reviewed studies to determine the standard number of variables used in your field. This background research helps you estimate the minimum sample size required for your specific analysis.
If data collection is already complete and you face a small sample size, prioritize model parsimony. Keep your regression equation as simple as possible. Remove variables that lack strong theoretical justification or fail to show significant bivariate correlations with your dependent variable.
When you possess many relevant variables but lack the sample size to support them, consider data reduction techniques. Principal Component Analysis allows you to condense multiple related variables into a few underlying components. You can perform this in SPSS by navigating to Analyze, selecting Dimension Reduction, and clicking Factor.
Navigating regression assumptions and model specifications can be challenging during a thesis project. If you find yourself struggling to balance model complexity with sample size limitations, professional guidance can clarify the process. Our research consultants at SPSS Solutions are always available to help you refine your methodology and interpret your SPSS output accurately.
Selecting the correct model requires discipline and statistical awareness. Chasing a high R-squared value by cramming variables into your analysis will ultimately harm your research quality. By understanding your sample constraints and utilizing metrics like Adjusted R-squared, you can build robust models that genuinely reflect population dynamics.
References
- Babyak, M. A. (2004). What you see may not be what you get: A brief, nontechnical introduction to overfitting in regression-type models. Psychosomatic Medicine, 66(3), 411-421.
- Cohen, J., Cohen, P., West, S. G., & Aiken, L. S. (2003). Applied multiple regression/correlation analysis for the behavioral sciences (3rd ed.). Lawrence Erlbaum Associates.
- Field, A. (2018). Discovering statistics using IBM SPSS statistics (5th ed.). SAGE Publications.
- Hair, J. F., Black, W. C., Babin, B. J., & Anderson, R. E. (2019). Multivariate data analysis (8th ed.). Cengage Learning.
- Tabachnick, B. G., & Fidell, L. S. (2019). Using multivariate statistics (7th ed.). Pearson.