Understanding Alpha Assessment: A Complete Guide to Cronbach’s Alpha in SPSS
Evaluating the reliability of survey instruments is a critical step in any quantitative research project. When developing questionnaires or psychological scales, researchers must ensure their items consistently measure the intended construct. This is where an alpha assessment becomes essential for validating your data collection tools. By running this reliability analysis, you can determine if your survey questions work together effectively.
What is an Alpha Assessment?
Alpha assessment, frequently referred to as Cronbach’s alpha, is a statistical coefficient that measures the internal consistency of a psychometric instrument. Internal consistency refers to the degree to which a set of items reliably measures the same underlying characteristic. This calculation yields a value between 0 and 1. Higher values generally indicate stronger agreement among the individual survey items.
When participants respond consistently to related questions, the assessment produces a high reliability score. For example, if a respondent rates one item highly on a customer satisfaction scale, they should logically rate similar items highly. This pattern confirms that the questions accurately capture the same conceptual framework. Researchers rely on this metric to justify their instrument choice before conducting advanced statistical modeling.
When to Use This Statistical Measure
You should conduct this analysis during the pilot phase of your research methodology. Testing a small sample allows you to evaluate the questionnaire structure before distributing it to your entire population. It prevents the costly mistake of collecting extensive data with a flawed or confusing instrument that yields unusable results.
This metric is primarily used for continuous data and ordinal metrics like Likert scales. Questionnaires measuring latent variables, such as employee motivation or academic anxiety, require this validation step. If your survey contains multiple subscales, you must compute a separate reliability coefficient for each individual construct rather than the entire questionnaire.
Interpreting the Reliability Coefficient
Evaluating the output requires understanding standard academic thresholds. A value of 0 indicates zero correlation among the items, meaning they are entirely independent. A value of 1 implies perfect correlation. Most social science disciplines accept a minimum benchmark of 0.70 to establish baseline reliability for a scale.
Scores between 0.80 and 0.90 are considered good or highly reliable for most academic theses. However, a score exceeding 0.95 is not necessarily a positive outcome. Extremely high values often suggest item redundancy. This means you are asking the exact same question in slightly different ways, unnecessarily increasing the length of your survey.
Key Assumptions and Limitations
Researchers often misunderstand what this coefficient actually represents. An alpha assessment measures reliability but it does not establish validity. Your questions might consistently measure a specific trait, but it might be the wrong trait entirely. You must establish construct validity separately through distinct methodological procedures.
Furthermore, a high score does not guarantee unidimensionality. An instrument measuring multiple related traits can still yield a high overall coefficient. To prove that your items measure a single underlying factor, you should conduct an Exploratory Factor Analysis or Principal Component Analysis prior to running reliability tests.
The Mathematical Framework
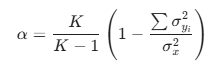
Understanding the underlying mathematics helps clarify how survey length impacts reliability. The standard statistical formula evaluates the number of items alongside the individual item variance. While statistical software handles the computation, reviewing the theoretical equation for Cronbach’s alpha reveals the mechanical relationship between these variables:
Executing this procedure in statistical software is straightforward for researchers at any skill level. First, you must ensure your data is properly coded in the variable view. Additionally, any negatively worded questions must be reverse-scored. Failing to reverse-score these specific items will artificially lower your reliability coefficient and misrepresent your results.
Navigate to the top menu and select Analyze, then Scale, and click on Reliability Analysis. Transfer your target variables into the Items box. Under the Model dropdown, ensure Alpha is selected. Click the Statistics button and check the box for “Scale if item deleted” before running the analysis.
Real Research Application and Output Interpretation
Imagine an MPhil student studying workplace burnout using a specialized five-item Likert scale. After surveying a pilot sample of 50 employees, they run the reliability analysis and observe an initial coefficient of 0.65. This preliminary score falls clearly below the acceptable academic threshold, indicating a foundational problem with the survey instrument.
By examining the “Item-Total Statistics” table in SPSS, the student reviews the “Cronbach’s Alpha if Item Deleted” column. They notice that removing the fourth question would increase the overall score to 0.82. This indicates that the fourth question is confusing or measuring a different construct, prompting its removal from the final study.
Conclusion and Next Steps
Validating your survey instruments is a non-negotiable aspect of rigorous academic research methodology. By carefully evaluating internal consistency before main data collection, you ensure your dataset provides a solid foundation for your subsequent inferential statistics. Taking the time to refine your measurement scales always leads to much stronger empirical findings.
If you are struggling with survey validation or interpreting complex statistical output, professional guidance can streamline your progress. Our team at SPSS Solutions provides dedicated support for MPhil and PhD candidates working through their quantitative methodology. Reach out to ensure your data analysis meets the highest academic standards.
References
- Cronbach, L. J. (1951). Coefficient alpha and the internal structure of tests. Psychometrika, 16(3), 297–334. https://doi.org/10.1007/BF02310555
- DeVellis, R. F., & Thorpe, C. T. (2021). Scale development: Theory and applications (5th ed.). SAGE Publications.
- Field, A. (2018). Discovering statistics using IBM SPSS statistics (5th ed.). SAGE Publications.
- Hair, J. F., Black, W. C., Babin, B. J., & Anderson, R. E. (2019). Multivariate data analysis (8th ed.). Cengage Learning.
- Tavakol, M., & Dennick, R. (2011). Making sense of Cronbach’s alpha. International Journal of Medical Education, 2, 53–55. https://doi.org/10.5116/ijme.4dfb.8dfd