Why There Are No P-Values in Nonlinear Regression: What to Use Instead
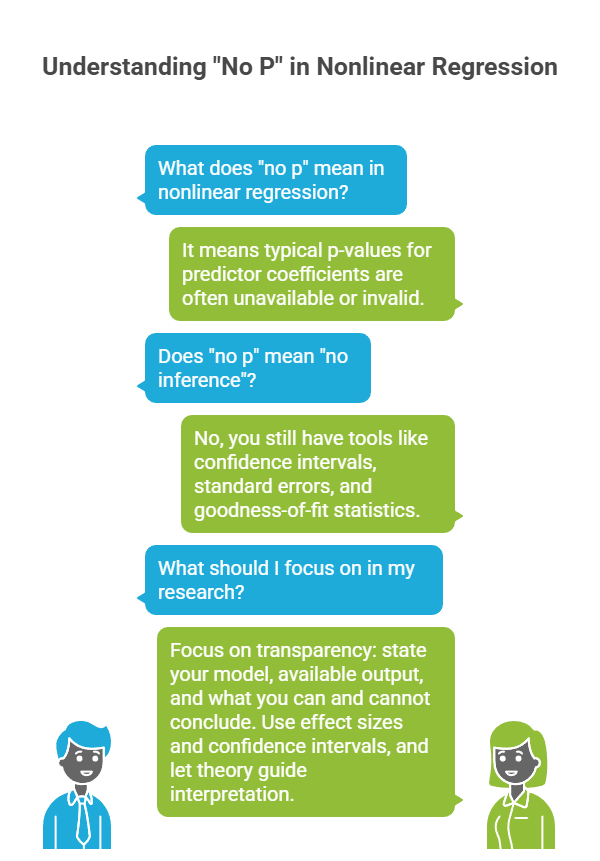
Researchers often expect p-values alongside their coefficients in regression output. But in nonlinear regression, “no p-values” is often the rule, not the exception. This post explains why, and what statistics you should rely on instead.
Introduction
P-values are ubiquitous in many statistical analyses. In linear regression, they seem almost automatic: you fit the model, you get estimates for coefficients, you test whether each is significantly different from zero, and you report p-values. But when you move into nonlinear regression (i.e. models that are nonlinear in one or more parameters), p-values for individual predictor coefficients are often unavailable, or even meaningless.
If you’ve ever asked “why is there no p for my nonlinear model?”, you’re not alone. This article will cover:
- What “no p” means in this context.
- Why p-values work in linear regression but not in many nonlinear regression setups.
- What statistics you can use instead (e.g. confidence intervals, standard errors, goodness-of-fit metrics).
- Practical implications: how to interpret nonlinear regression output without p-values, and how to report it in your research.
What “No P” Means in Nonlinear Regression
When someone says “no p” in reference to nonlinear regression, they typically mean:
- The regression software did not provide p-values for the estimated coefficients.
- You cannot validly test a null hypothesis of the form “coefficient = 0” using the usual t or Z test, because the theory underlying those p-values doesn’t apply in many nonlinear regression situations.
In linear regression the p-values for coefficients test hypotheses like:

assuming the model is linear in parameters, errors are normally distributed (or large sample approximation), etc.
Why P-Values Are Possible in Linear Regression but Usually Not in Nonlinear Regression
Here are the key reasons:
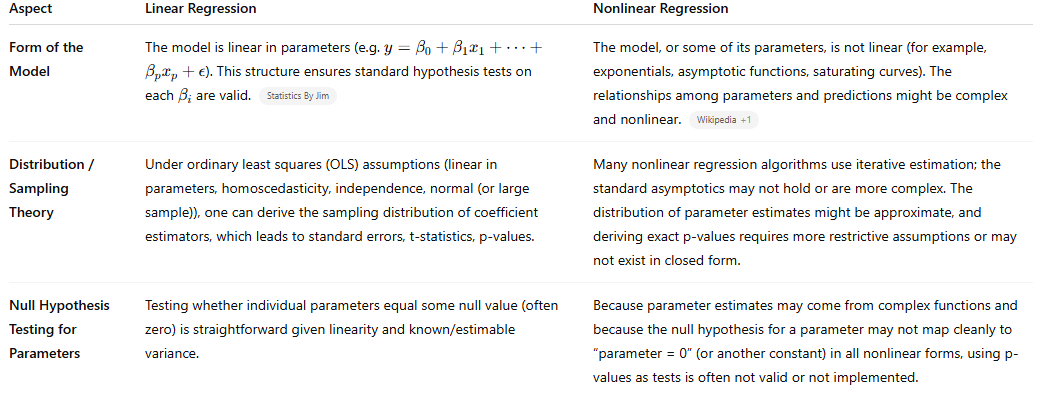
Jim Frost explains that because nonlinear regression is so flexible — many possible functional forms — you can’t have a universal test for parameter significance like the t-test used in linear regression.
What to Use Instead of P-Values
When p-values are unavailable or inappropriate, these alternatives allow meaningful inference and reporting:
- Confidence Intervals for Parameter Estimates
Rather than testing “coefficient = 0,” look at whether the confidence interval for an estimated parameter excludes some null value (often zero, but could be another value depending on theory). If zero (or your null hypothesized value) is not in the interval, it’s evidence against the null. Jim Frost recommends this approach. - Standard Error (SE) of Parameter Estimates
Use standard errors to gauge precision. Large SE relative to the coefficient suggests imprecision; small SE suggests more reliable estimates. - Goodness-of-Fit Measures
- Use standard error of the regression (or residual standard error) to compare how well different nonlinear models fit.
- Examine residual plots to check for patterns (bias, heteroscedasticity, misfit).
- Use information criteria where available (AIC, BIC) to compare model alternatives.
- Visual Methods
- Plot data vs fitted curve.
- Overlay prediction or confidence bands if software allows.
- Check shape of residuals vs fitted values.
- Bootstrap Methods
When asymptotic theory is weak or assumptions are questionable, bootstrap confidence intervals provide nonparametric estimation of uncertainty in parameter estimates.
Practical Examples & Software
Here are how different software tools handle “no p” for nonlinear regression and what you can do as a researcher.
- R
- Nonlinear regression is performed via
nls()or other packages (e.g.nlme). These often provide parameter estimates, standard errors, sometimes approximate t statistics, but p-values for individual parameters are not always given or reliable. You can extract confidence intervals usingconfint()or via bootstrapping.
- Nonlinear regression is performed via
- Python
- Libraries like
scipy.optimize.curve_fit,statsmodels.nonlin, or more advanced ones provide parameter estimates and covariance matrix. From covariance, approximate standard errors and confidence intervals can be constructed. Be cautious interpreting t-values/p-values if software includes them.
- Libraries like
- SPSS
- SPSS has nonlinear regression procedures (e.g. Nonlinear Regression module). Often it reports parameter estimates and standard errors, but not p-values for terms in the nonlinear part. Users can examine confidence intervals and residual standard error.
Hypothetical Example: Suppose you fit a nonlinear growth curve model in R using nls():
You get estimates for β1 and β2, standard errors, and maybe an approximate t statistic. But the model output doesn’t include a p-value (or includes one that the documentation warns is approximate). You check:
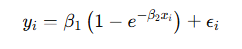
- Whether the confidence interval for β2\beta_2 excludes zero.
- The residual standard error of the model.
- Diagnostic plots.
- Maybe bootstrap the parameters.
Implications for Research Reporting
How should you write up your nonlinear regression results given “no p”?
- Be explicit: state that you used a nonlinear regression model, and that p-values for coefficients are unavailable (or not valid) in this context.
- Report parameter estimates and their confidence intervals and standard errors.
- Provide measures of model fit: residual standard error, AIC/BIC if applicable, etc.
- Include diagnostic plots or goodness-of-fit visuals.
- Interpret effect sizes (coefficient magnitudes) in context, not only statistical significance.
Common Questions (FAQ)
Q: Can I ever get p-values in nonlinear regression?
A: Sometimes approximate tests exist, or when the model is transformable into a linear form. But in most general nonlinear models, built directly in terms of nonlinear parameters, p-values are either not provided, or their validity is questionable.
Q: Why don’t software packages just give p-values anyway?
A: Because deriving them correctly requires assumptions that often don’t hold; providing inaccurate or misleading p-values would do more harm than good. Many packages avoid providing them to prevent misuse.
Q: Does “nonlinear” here mean polynomial regression?
A: Not necessarily. Polynomial regression (e.g. linear regression with x² terms) is still linear in parameters and so does have p-values. “Nonlinear regression” in this context means models nonlinear in parameters, e.g. exponential models, asymptotic curves, certain saturation functions, etc.
Q: How many data points do I need for credible nonlinear regression without p-values?
A: Larger samples help. Confidence intervals and standard errors depend heavily on sample size. When sample size is small, uncertainty is large, and results should be interpreted cautiously.
Conclusion
In summary, the phrase “no p” in nonlinear regression refers to the fact that typical p-values for predictor coefficients are often unavailable or invalid in models that are nonlinear in parameters. But “no p” does not mean “no inference” — you still have tools: confidence intervals, standard errors, goodness-of-fit statistics, bootstrap, diagnostic plots, etc.
For your research, focus on transparency: state what your model is, what output is available, what you can and cannot conclude. Use effect sizes and confidence intervals more heavily, and let theory and domain knowledge guide interpretation.
References
- Frost, J. “Why Are There No P Values in Nonlinear Regression?” Statistics By Jim. Statistics By Jim
- Nonlinear regression. Wikipedia. Wikipedia
- O’Brien, T. E., et al. (2024). Nonlinear Regression Modelling: A Primer with Examples and Caveats. PMC.