Mastering the F-Table and Degrees of Freedom Formulations in SPSS
Hypothesis testing often requires researchers to compare variance across multiple groups. This statistical process relies heavily on the F-distribution and its associated probability tables. To accurately interpret an F-test, you must apply the correct freedom formulations for your data. Understanding these freedom formulations ensures you select the precise critical value needed to evaluate statistical significance. This guide will explain how to read F-tables and apply these concepts in your research.
What is an F-Table?
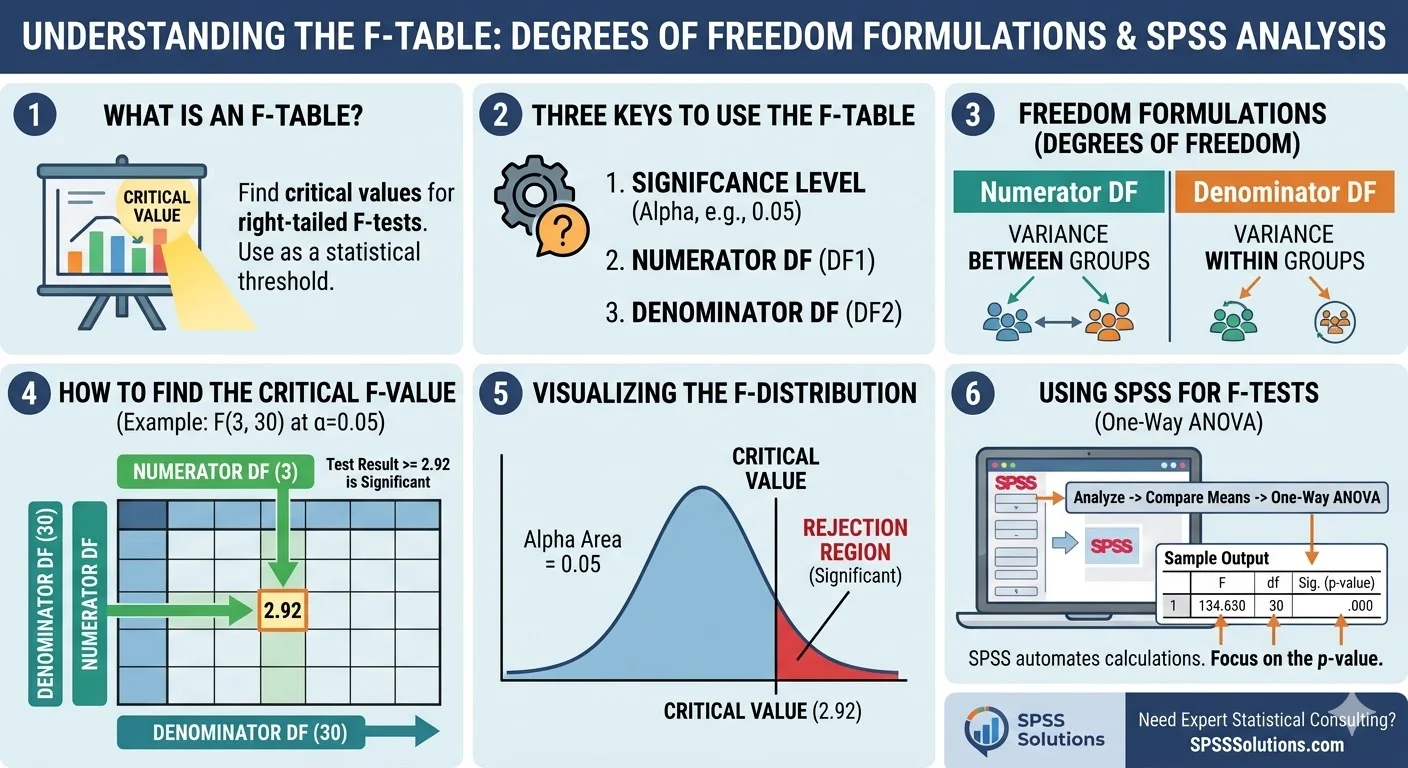
An F-table is a statistical reference chart that provides critical values for right-tailed F-tests. Researchers use these tables to determine if their calculated F-statistic is large enough to reject the null hypothesis. The critical value acts as a threshold for your data. If your test result exceeds this numeric threshold, your findings are statistically significant.
The Core Elements of an F-Table
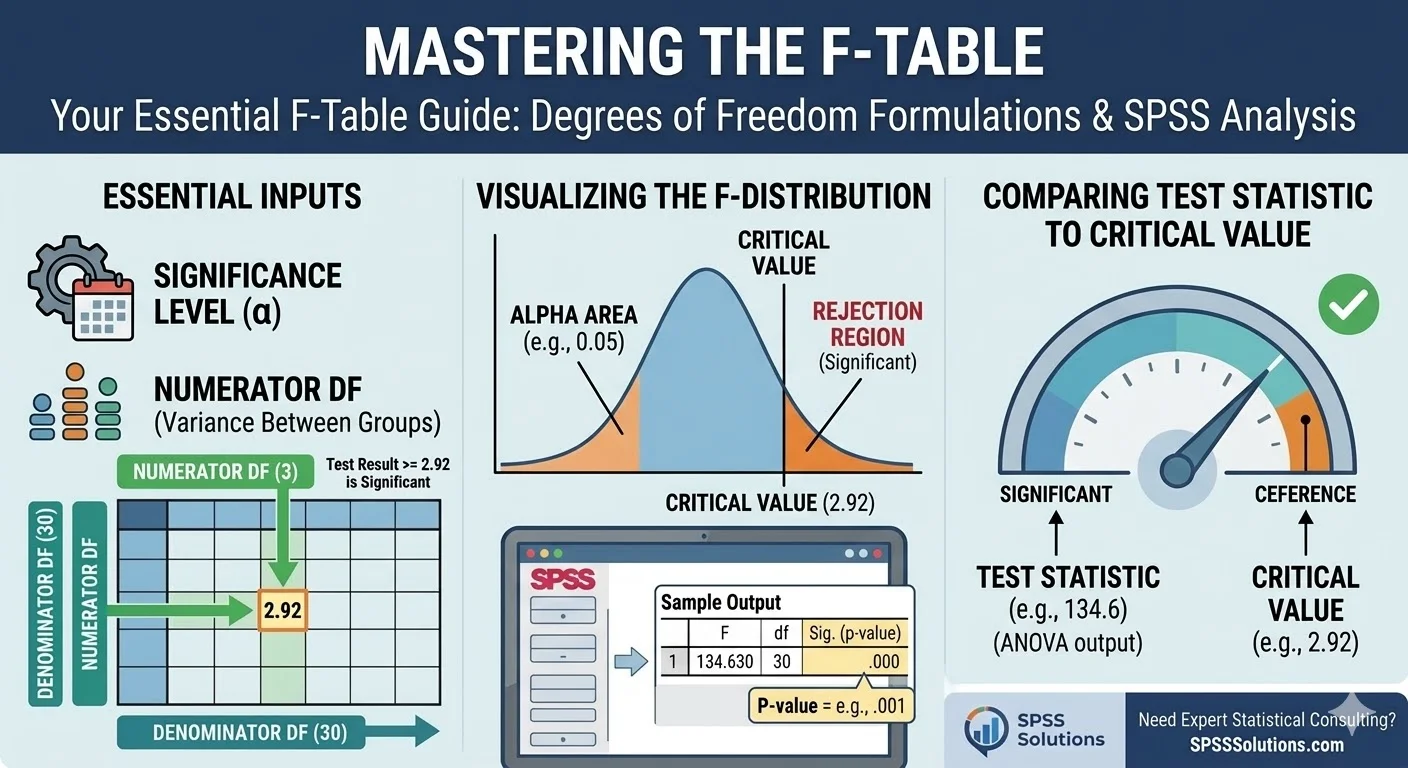
Reading an F-table requires three specific pieces of information from your study. You need the chosen significance level, the numerator degrees of freedom, and the denominator degrees of freedom. Most statistical textbooks provide tables for common significance levels like 0.10, 0.05, and 0.01. Each significance level has its own dedicated reference table.
The Role of Degrees of Freedom Formulations
The F-distribution changes shape based on the sample size and the number of groups being compared. You define this specific shape using appropriate freedom formulations. The numerator degrees of freedom represent the variance found between your research groups. The denominator degrees of freedom represent the variance found within those specific groups.
How to Find the Critical F-Value
Start your analysis by selecting the table that matches your chosen significance level. Next, locate the specific column corresponding to your numerator degrees of freedom. Then, find the row that matches your denominator degrees of freedom. The single cell where this column and row intersect contains your critical F-value.
A Practical Example of Reading the F-Table
Suppose you are conducting an Analysis of Variance for your thesis with an alpha level set at 0.05. Your research design yields 3 numerator degrees of freedom and 30 denominator degrees of freedom. Researchers typically write this notation as F(3, 30) in their academic reports.
First, open the standard F-table for the 0.05 significance level. Locate the column designated for 3 and the row designated for 30. The intersection of these two points reveals a critical value of 2.92. If your calculated F-statistic is 2.92 or higher, your research results are statistically significant.
Analyzing F-Values in SPSS
Modern researchers rarely look up critical F-values manually using physical charts. Statistical software automates this entire mathematical process for you. When you run an ANOVA in SPSS, the final output provides the F-statistic, the necessary degrees of freedom, and the exact p-value for your analysis.
To generate this specific output in SPSS, navigate to the Analyze menu, click Compare Means, and select One-Way ANOVA. Move your dependent variable to the Dependent List box and your independent variable to the Factor box. The resulting ANOVA table will display the exact freedom formulations used by the software.
Interpreting the SPSS Output
Using SPSS eliminates the tedious need to look up critical values in a physical textbook table. The software calculates the exact probability value for your unique F-statistic automatically. You simply compare the significance column in your output table to your chosen alpha level. If the significance value falls below 0.05, you reject the null hypothesis entirely.
Navigating F-distributions and interpreting complex statistical outputs can be challenging for students and researchers. Applying the correct freedom formulations is critical for the statistical validity of your thesis or dissertation. If you need professional guidance with your data analysis, SPSS Solutions provides expert statistical consulting. Our academic team can help you run your tests correctly and interpret the results with confidence.
References
- Field, A. (2018). Discovering statistics using IBM SPSS statistics (5th ed.). SAGE Publications.
- Hair, J. F., Black, W. C., Babin, B. J., & Anderson, R. E. (2019). Multivariate data analysis (8th ed.). Cengage Learning.
- Howell, D. C. (2012). Statistical methods for psychology (8th ed.). Cengage Learning.
- Pallant, J. (2020). SPSS survival manual: A step by step guide to data analysis using IBM SPSS (7th ed.). McGraw-Hill Education.
- Tabachnick, B. G., & Fidell, L. S. (2019). Using multivariate statistics (7th ed.). Pearson.