Why Your R-Squared Is Too High and How to Fix It
As a researcher running data in SPSS, you probably hope for a high R-squared value. This metric tells you how much variance in your dependent variable your statistical model explains. Finding a value above 90 percent feels like a massive academic victory. However, there are times when the variance explained by your regression is too much, pointing to critical flaws in your model.
In the physical sciences, highly predictable environments can produce genuinely massive R-squared values. Human behavior is completely different. Social science data contains inherent unpredictability and random noise. If your psychology or business thesis shows an R-squared of 95 percent, your committee will likely ask hard questions.
We need to look at why your model looks perfect on paper but fails in reality. An artificially inflated R-squared creates misleading coefficients and ruins the generalizability of your study. Let us explore the common reasons behind this issue and how to resolve them using SPSS.
Five Reasons Your R-Squared is Artificially High
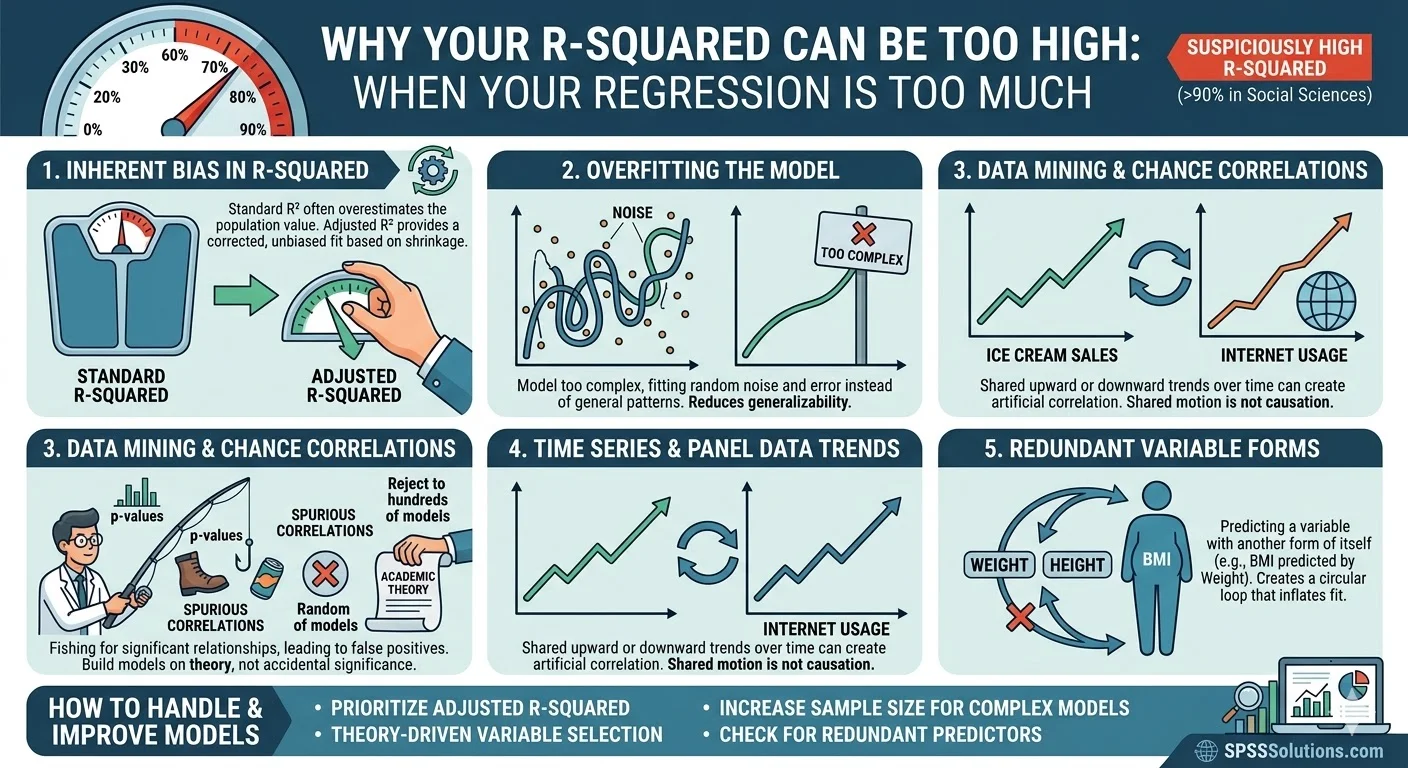
1. The R-Squared Estimate is Inherently Biased
The standard R-squared value calculated from your sample data is a biased estimator. A biased estimator is a statistical value that systematically overestimates or underestimates the true population parameter. In linear modeling, standard R-squared almost always reads higher than the actual population value. This bias occurs because the calculation capitalizes on random chance within your specific sample.
To correct this upward bias, researchers must look at the Adjusted R-squared value. Adjusted R-squared applies a mathematical penalty based on the number of predictors and your sample size. This shrinkage ensures your goodness-of-fit metric reflects reality rather than sample specific noise. In SPSS, you will find this metric right next to the standard R-squared in your Model Summary table.
2. Overfitting Your Statistical Model
Overfitting occurs when your statistical model is far too complex for your specific sample size. The model begins to map the random errors and noise in your dataset rather than the actual relationships between variables. This complexity generates a massive R-squared value that looks impressive but is entirely mathematically useless.
An overfitted model lacks any generalizability outside of your current dataset. If you collect a second sample and apply the exact same regression equation, the predictive power will collapse. A common rule of thumb is to ensure you have at least ten to fifteen participants for every independent variable in your model.
3. Data Mining and Spurious Correlations
Data mining involves running dozens of different regression models to see which variables yield statistically significant results. Automated procedures like stepwise regression in SPSS are particularly guilty of this. When you run countless hypothesis tests, you inevitably stumble upon false positives due to random statistical chance.
If you build your final thesis model based solely on these accidental significant p-values, your R-squared will inflate artificially. You are essentially grouping together random variables that happen to correlate perfectly in your specific sample. Researchers must always build their models based on established academic theory rather than fishing for significant outputs.
4. Unintended Time Series Trends
Panel data and time series data require special attention during academic analysis. If your dependent variable and your independent variables both naturally increase over time, they will appear highly correlated. This shared upward or downward trajectory produces a dangerously high R-squared value that does not imply actual causation.
For example, global ice cream sales and global internet usage have both increased steadily over the last twenty years. A regression model predicting internet usage based on ice cream sales would show incredible fit. To fix this, you must use time series analysis techniques like differencing rather than standard linear regression.
5. Including Redundant Variable Forms
Sometimes researchers accidentally include a different mathematical form of the dependent variable as an independent predictor. This creates a circular loop in your model that instantly drives your R-squared toward 100 percent. It is a common mathematical mistake when dealing with complex survey scoring and composite index variables.
Imagine you are researching public health outcomes and your dependent variable is Body Mass Index. If you include patient weight as an independent variable, your model will be artificially perfect. Body Mass Index is directly calculated using weight, meaning you are essentially predicting a variable using itself.
How to Handle High R-Squared in SPSS
You can easily monitor and correct these goodness-of-fit issues directly within your statistical software. When running your analysis via the Analyze dropdown, navigate to Regression and then Linear. Always ignore the standard R-squared column in the resulting Model Summary table. Focus entirely on the Adjusted R-squared to get an honest assessment of your model.
If your Adjusted R-squared is still suspiciously high, you need to review your variable selections. Remove any predictors that are mathematically redundant. Ensure your sample size is large enough to support the number of variables you are testing. Building your model on strong theoretical foundations is the best defense against inflated statistics.
Expert Support for Your Research Journey
Navigating complex statistical outputs can feel overwhelming when you are trying to finalize your thesis or dissertation. Interpreting whether a model is overfitted or genuinely strong requires a deep understanding of methodology. If you feel stuck on your data analysis, reaching out for professional guidance can save you weeks of frustration.
Our team at SPSS Solutions specializes in helping students and researchers build methodologically sound models. We can help you clean your data, run the correct tests, and interpret your outputs accurately for your final defense. Feel free to contact us to discuss how we can support your academic research.
References
- Cohen, J., Cohen, P., West, S. G., & Aiken, L. S. (2003). Applied multiple regression/correlation analysis for the behavioral sciences (3rd ed.). Routledge.
- Field, A. (2018). Discovering statistics using IBM SPSS statistics (5th ed.). Sage Publications.
- Hair, J. F., Black, W. C., Babin, B. J., & Anderson, R. E. (2019). Multivariate data analysis (8th ed.). Cengage Learning.
- Montgomery, D. C., Peck, E. A., & Vining, G. G. (2021). Introduction to linear regression analysis (6th ed.). John Wiley & Sons.
- Tabachnick, B. G., & Fidell, L. S. (2019). Using multivariate statistics (7th ed.). Pearson.