Understanding the F-Table and Critical Values in SPSS Analysis
Analyzing educational data often requires researchers to compare multiple groups. You might download a reading level correlation chart pdf to map out student progress across different grades. However, proving that teaching methods significantly differ requires rigorous statistical testing. This is where the F-test and the corresponding statistical tables become essential tools for your research.
What is an F-Table in Statistics?
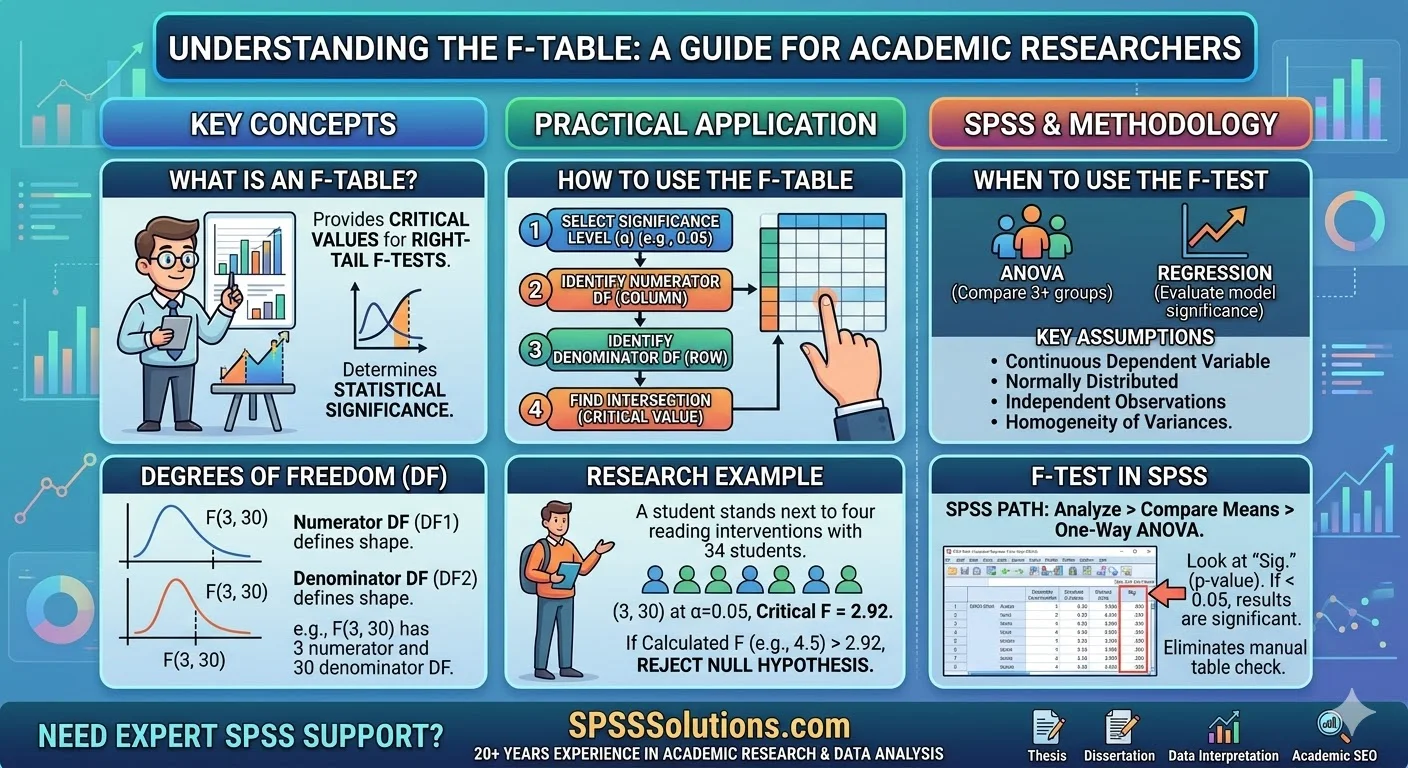
The F-table provides the critical values necessary for evaluating right-tail F-tests. Your statistical test results are considered significant when your calculated test statistic exceeds this specific critical value. The shape of the F-distribution relies entirely on two statistical parameters. These are the numerator and the denominator degrees of freedom.
Degrees of freedom represent the number of independent values that can vary in your analysis. For example, a notation of F(3, 30) indicates three numerator degrees of freedom and thirty denominator degrees of freedom. You must identify these specific values to locate the correct intersection within your chart.
When to Use the F-Test
Researchers commonly use the F-test when conducting an Analysis of Variance (ANOVA). This test helps determine if there are statistically significant differences between the means of three or more independent groups. You will also encounter the F-test when evaluating the overall significance of regression models.
You should not use the F-test when comparing only two groups. An independent samples t-test is more appropriate for that specific scenario. The F-test specifically evaluates variance ratios across multiple categories simultaneously.
Key Statistical Assumptions
Before calculating your F-statistic, your data must meet several underlying assumptions. The dependent variable must be continuous and normally distributed within each group. The observations must be completely independent of one another. Finally, there must be homogeneity of variances across all tested groups.
How to Read the Critical Values
Researchers must first select a table based on their chosen significance level. The most common significance levels in academic research are 0.10, 0.05, and 0.01. The columns on the chart specify the numerator degrees of freedom. The rows define the denominator degrees of freedom for your specific dataset.
To find your critical value, locate the intersection of your chosen column and row. If your computed F-statistic is greater than the number found in this cell, you reject the null hypothesis. This indicates that your results are statistically significant.
A Practical Research Example
Suppose you test four distinct reading interventions on 34 students. Your numerator degrees of freedom would be 3. Your denominator degrees of freedom would be 30. You select a standard 0.05 significance level for your study.
You locate the column for 3 and the row for 30 in your table. The intersection reveals a critical F-value of 2.92. If your calculated F-test statistic is 2.92 or higher, your interventions have produced a statistically significant difference in student outcomes.
Running the F-Test in SPSS
Modern statistical software eliminates the need to manually consult paper tables. SPSS calculates the F-statistic and provides an exact probability value automatically. You can access the most common application of the F-test through a simple menu sequence.
In the top menu bar, click Analyze. Select Compare Means from the dropdown list. Click on One-Way ANOVA. Move your dependent variable into the Dependent List box. Place your categorical independent variable into the Factor box. Click OK to generate your output.
Interpreting Your Output
The resulting ANOVA table displays your sum of squares, degrees of freedom, mean square, F-value, and Significance (p-value). You do not need to compare the F-value to a table manually. You simply look at the column labeled Sig.
If your Sig value is less than your chosen alpha level of 0.05, your test is significant. This means at least one group differs from the others. If you find yourself struggling with complex SPSS output or interpreting degrees of freedom, reaching out for professional data analysis support can save you valuable time.
Our team at SPSS Solutions provides dedicated assistance for thesis writers and academic researchers. We can help you navigate complicated datasets, select the appropriate statistical tests, and interpret your results accurately for your final manuscript.
References
- Field, A. (2018). Discovering statistics using IBM SPSS statistics (5th ed.). SAGE Publications.
- Howell, D. C. (2012). Statistical methods for psychology (8th ed.). Cengage Learning.
- Pallant, J. (2020). SPSS survival manual: A step by step guide to data analysis using IBM SPSS (7th ed.). Routledge.
- Tabachnick, B. G., & Fidell, L. S. (2019). Using multivariate statistics (7th ed.). Pearson.
- Warner, R. M. (2013). Applied statistics: From bivariate through multivariate techniques (2nd ed.). SAGE Publications.