What Are Latent Variables? Measuring the Unmeasurable

What Are Latent Variables? Measuring the Unmeasurable As a psychologist, I often sit with clients and discuss profound concepts: anxiety, intelligence, extraversion, or resilience. We know these things exist. We feel them. We see their impact on our lives every single day. But if you asked me to put “resilience” in a jar or weigh

Understanding Cohen’s Kappa

Understanding Cohen’s Kappa

Cohen’s Kappa Explained: Measuring Reliability in Psychology Research Imagine a patient named Sarah. She visits Dr. A because she’s been feeling persistently low, tired, and unmotivated. Dr. A conducts an assessment and diagnoses her with Major Depressive Disorder. Seeking a second opinion, Sarah visits Dr. B the following week. Dr. B asks similar questions but

Is Your Research Reliable? Understanding Fleiss’ Kappa

Understanding Fleiss’ Kappa

Is Your Research Reliable? Understanding Fleiss’ Kappa Imagine you are the lead clinical psychologist at a busy diagnostic center. A new patient walks in displaying complex symptoms. You ask three different clinicians to assess this patient independently to determine if they meet the criteria for Major Depressive Disorder. Doctor A says “Yes.” Doctor B says

How to Create Dummy Variables in SPSS?

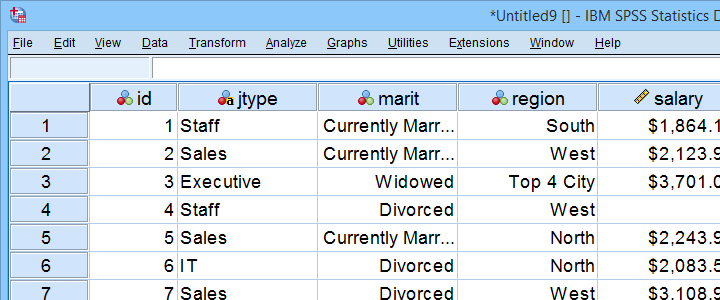
How to Create Dummy Variables in SPSS? By Ruben Geert van den Berg under Regression You can’t readily use categorical variables as predictors in linear regression: you need to break them up into dichotomous variables known as dummy variables.The ideal way to create these is our dummy variables tool. If you don’t want to use

Clustered Bar Chart over Multiple Variables

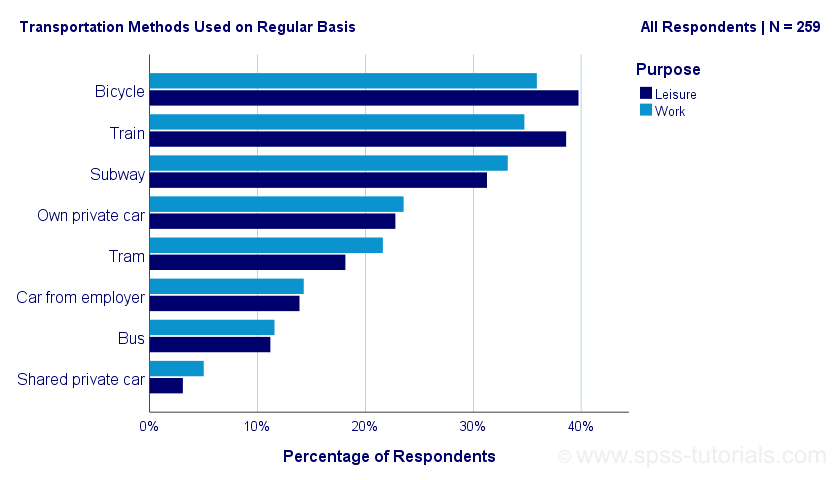
Clustered Bar Chart over Multiple Variables By Ruben Geert van den Berg under Charts in SPSS Example Data VARSTOCASES without VARSTOCASES Restructuring the Data SPSS Chart Builder – Basic Steps Final Result This tutorial shows how to create the clustered bar chart shown below in SPSS. As this requires restructuring our data, we’ll first do

SPSS Chi-Square Test with Pairwise Z-Tests

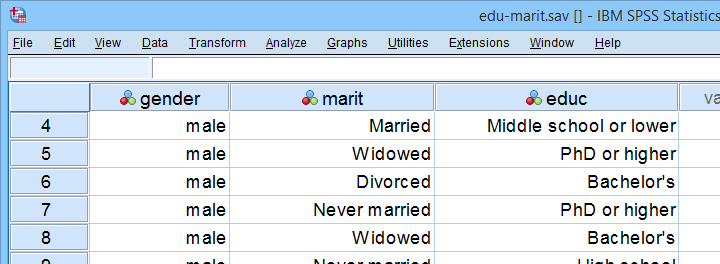
SPSS Chi-Square Test with Pairwise Z-Tests By Ruben Geert van den Berg under Chi-Square Tests Most data analysts are familiar with post hoc tests for ANOVA. Oddly, post hoc tests for the chi-square independence test are not widely used. This tutorial walks you through 2 options for obtaining and interpreting them in SPSS. Option 1

SPSS ANOVA without Raw Data

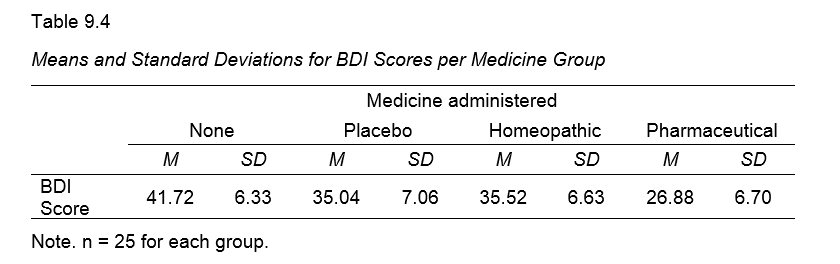
SPSS ANOVA without Raw Data By Ruben Geert van den Berg under ANOVA 1. Set Up Matrix Data File 2. SPSS Oneway Dialogs 3. Adjusting the Syntax 4. Interpreting the Output In SPSS, you can fairly easily run an ANOVA or t-test without having any raw data. All you need for doing so are the

Why There Are No P-Values in Nonlinear Regression: What to Use Instead

Why There Are No P-Values in Nonlinear Regression What to Use Instead

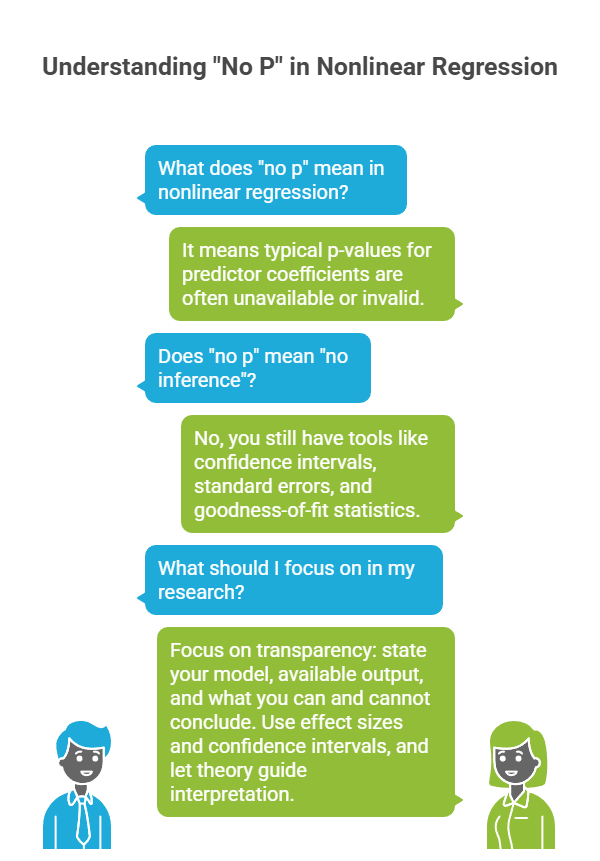
Why There Are No P-Values in Nonlinear Regression: What to Use Instead Researchers often expect p-values alongside their coefficients in regression output. But in nonlinear regression, “no p-values” is often the rule, not the exception. This post explains why, and what statistics you should rely on instead. Introduction P-values are ubiquitous in many statistical analyses.